Shopping cart
You have no items in your shopping cart.

You have no items in your shopping cart.

JBOSS FUSE
ECLIPSE CHE
Eclipse Che is a cloud-based integrated development environment that provides a modern and streamlined development experience. With Hoolia's Eclipse Che offering, you can access your development environment from anywhere, collaborate with your team in real-time, an...
CUCUMBER / SELENIUM GRID

3SCALE API

DEVELOPER PORTAL
A good developer portal is a must have to assure adoption of your API. Red Hat® 3scale API Management makes it easy to manage your APIs. Event-Dri...
Java
Node Js
Python
RESELLER / WHITELABEL

RESELLER / WHITELABEL is a web hosting model, where a web hosting provider allows either some or all of their hosting services to be sold by a third party or an individual. Essentially, you can set up a web hosting provider without needing to build, operate or manage the infrastructure. Sounds...
DNS DOMAINNAME

DNS (Domain Name System) is a system that translates human-readable domain names into numerical IP addresses that computers can understand. It is an essential component of the internet that allows users to access websites and other resources b...
TLS CERTIFICATE

TLS (Transport Layer Security) is a protocol that is used to establish secure communication between two parties over the internet. TLS certificates are used to authenticate the identity of a website or server, and to establish an encrypted con...
PRESTASHOP – ECOMMERCE PLATFORM

At Hoolia, we believe that our Prestashop hosting service can be a valuable asset to your e-commerce platform. We provide the support and guidance you need to succeed.
DRUPAL – CMS
WORDPRESS – CMS
WORDPRESS - CMS is a user-friendly content management system (CMS) for building and managing websites. With its intuitive interface and customizable features, it makes website creation and maintenance quick and efficient. It also offers a variety of...
GitHub Actions

GitHub Actions makes it easy to automate all your software workflows, now with world-class CI/CD. Build, test, and deploy your code right from GitHub. Make code reviews, branch management, and issue triaging work the way you want.
Kibana - Grafana
Kibana and Grafana are both open-source visualization and analytics tools that are commonly used to monitor and analyze data from various sources. Kibana is a part of the Elastic Stack, a set of tools for searching, analyzing, and visualizing data. It is often used for l...
Jenkins / Tekton Pipelines

Jenkins is an open source automation server that provides a range of tools and technologies for building, testing, and deploying software. It is a popular choice for continuous integration and delivery (CI/CD) pipelines, and it is widely used by organizations of all size...
GITLAB
SMTP / IMAP SERVER
SMTP (Simple Mail Transfer Protocol) is a protocol used for sending email messages between servers. Most email systems that send mail over the Internet use SMTP to send messages from one server to another, and to deliver messages to local mail clients like Microsoft Outl...
OWNCLOUD

MICROSOFT OFFICE365
Microsoft Office 365 is a subscription-based online suite of productivity tools that includes a range of applications, services, and features.
STAKING SERVICES

Overall, staking services provide a convenient and secure way for users to participate in the staking process and earn rewards for helping to secure blockchain networks.
MASTER NODES
Master nodes are the nodes in a Kubernetes cluster that are responsible for the overall management of the cluster. They are responsible for maintaining the overall state of the cluster, scheduling workloads, and providing an interface for users and other components to interact with the cluster...
UTILITY NODES

Utility nodes are nodes in a graph that perform a specific function or operation but do not have any input or output connections. They are typically used to provide additional functionality or to simplify the creation of complex graphs.
ASIC / GPU COLOCATION

ASIC (Application-Specific Integrated Circuit) and GPU (Graphics Processing Unit) colocation refers to the practice of hosting and maintaining ASIC and GPU-based mining equipment in a third-party facility. Colocation can provide several benefits to miners, including access to low-cost electric...
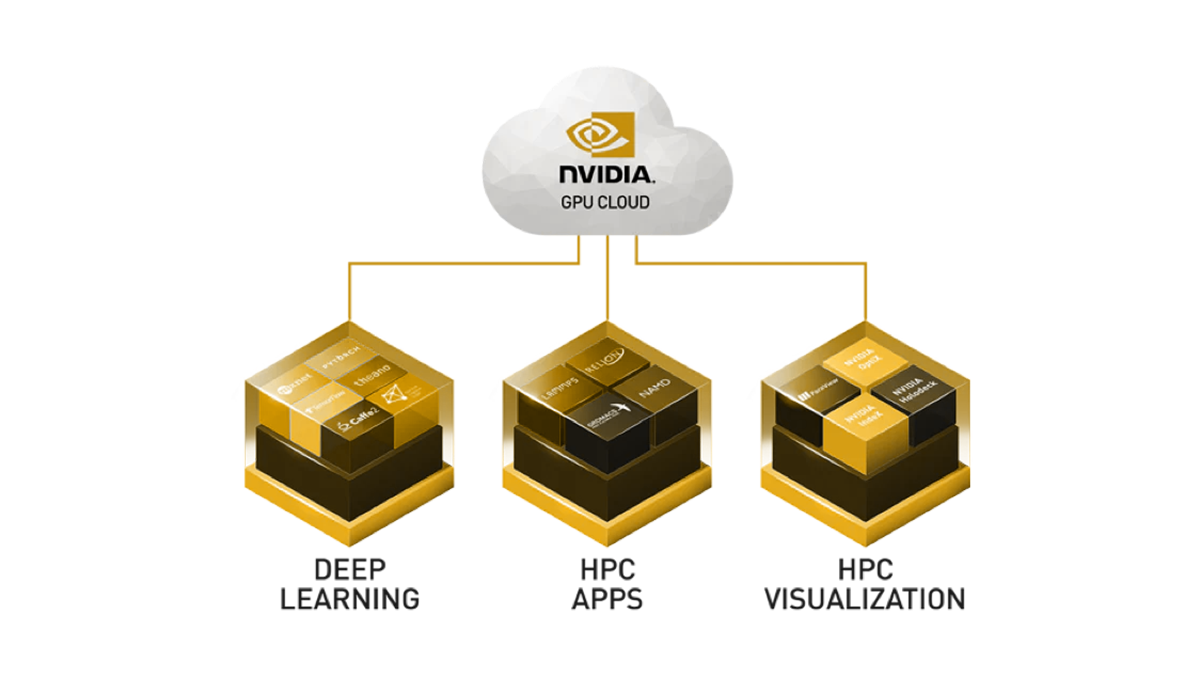
GPU CLOUD MINING

GPU cloud mining is the process of using a cloud-based platform to perform cryptocurrency mining using graphics processing units (GPUs).
Ray Cluster

Ray Cluster is a cutting-edge clustering solution, designed to optimize data processing for businesses. With its advanced features, users can enjoy improved efficiency, accuracy, and speed in their data management, resulting in increased productivit...
OpenDataHub

KAFKA STREAMS
Apache Kafka is a distributed streaming platform that is commonly used for building real-time data pipelines and streaming applications. Kafka Streams is a Java library for building these types of applications, which allows you to implement stream p...
JUPYTER NOTEBOOK

GPU CLOUD SERVICES
S3 – OBJECT STORAGE

S3 (Simple Storage Service) is an object storage service that offers industry-leading scalability, data availability, security, and performance. This makes it suitable for storing and retrieving any amount of data from anywhere on the web. Object storage is a new kind of...
KNATIVE – FUNCTIONS

Knative Functions, also known as Knative Serving, is a component of the Knative open-source platform that enables you to build, deploy, and manage serverless applications on Kubernetes. It allows you to run code in response to specific events, such ...
OPENSHIFT CONTAINER PLATFORM – PUBLIC CLOUD

OpenShift Container Platform is a cloud-based platform for deploying and managing containerized applications. It is based on the open-source Kubernetes container orchestration system and provides a number of additional fe...
KUBERNETES CONTAINER PLATFORM – PRIVATE COUD
Kubernetes is an open-source container orchestration platform that is designed to automate the deployment, scaling, and management of containerized applications. It can be used to deploy and run applications on a private cloud infrastructure.
K3S – SINGLE-NODE KUBERNETES

K3S is a lightweight Kubernetes distribution that is designed to be easy to install and operate. It is specifically optimized for use on resource-constrained devices such as edge computers, IoT devices, and other environments where a full-fledged Kubernetes cluster may b...
SERVICEMESH

SERVICEMESH refers to a dedicated infrastructure layer for facilitating communication and managing interactions between microservices within a distributed application. Microservices are small, independently deployable units of software that wor...
Rancher Kubernetes Engine

WINDOWS VDI
Windows VDI stands for "Windows Virtual Desktop Infrastructure." It refers to a technology that enables organizations to host and manage Windows desktop operating systems and applications virtually in a centralized environment. With Windows VDI, desktop instances run on virtual machines ...
WINDOWS SERVER

Windows Server is designed to provide a platform for running networked applications and services within organizations. Windows Server operating systems are specifically tailored to meet the needs of businesses and enterprises, offering features and ...
UBUNTU

...
RED HAT

1U – SINGLE SERVER

A 1U server is a type of computer server that is designed to be mounted in a standard 19-inch rack. The term "1U" refers to the server's size, which is 1 rack unit in height. A rack unit, or "U," is a standard unit of measurement used to describe the size of equipment t...
FULL RACK

DEDICATED CAGE
HPC

BACKUP – OFF-SITE STORAGE
Off-site backup is a method of backing up data to a remote server or to media that is transported off-site.
CDN – DISTRIBUTED STORAGE

Lorem ipsum dolor sit amet consectetur, adipisicing elit. Ducimus a tempora blanditiis quisquam. Consectetur nesciunt eveniet, aperiam error obcaecati in accusamus doloremque accusantium, odio fugiat dolorum nihil pariatur explica...
MYSQL DATABASE CLUSTER

MySQL Database Cluster is a technology that enables you to create a group of MySQL servers that work together to provide high availability and scalability for your database applications. A MySQL cluster consists of a group of MySQL servers that are ...
TRUENAS – FILE STORAGE

TrueNAS is an open-source storage platform that provides a range of features for storing, protecting, and managing data.
VPN – DIRECT CONNECT

HELIUM – 5G EDGE HOTSPOT

CHECKPOINT – FIREWALL

A firewall is a network security system that monitors and controls incoming and outgoing network traffic based on predetermined security rules. A firewall can be hardware-based, software-based, or a combination of both. I...
F5 BIG-IP – LOAD-BALANCER

NGINX – REVERSE-PROXY

NGINX is a web server that can also be used as a reverse proxy because it is fast and lightweight. It can handle a large number of connections concurrently and is able to efficiently serve static content such as images an...
RED HAT SSO

RED HAT Single Sign-On (RH-SSO) enables you to secure your web applications by providing Web single sign-on (SSO) capabilities. Red Hat Single Sign-On is also included in Red Hat Runtimes. Application security must be built-in from the start, not bolted on as an afterthou...
CYBERARK CONJOUR

CYBERARK CONJOUR is a tool for managing and distributing credentials in a secure manner. It is designed to help organizations secure access to their systems and applications by providing a centralized platform for managing and distributing credentials.
HASHICORP – PASSWORD MANAGEMENT

Hashicorp is a software company that offers a range of tools for infrastructure automation, including a password management tool called "Vault." Vault is a tool for securely storing and managing sensitive information, such as passwords, API keys, an...
FORTIGATE – FIREWALL

Fortinet is the pioneer of secure networking, delivering flawless convergence that can scale to any location: remote office, branch, campus, data center, and cloud. FortiGate is the heart of FortiOS Everywhere, providing deep visibility and security in a variety of form factors, including cont...
Kibana - Grafana
At Hoolia, we provide companies with the best Kibana - Grafana service available. We understand that managing Kibana - Grafana can be a daunting task, and that is why we take the burden off our customers by providing an all-inclusive Kibana - Grafana service. Our service is tailored to meet the needs of each customer, and we provide the most reliable and secure way to manage Kibana - Grafana.


